


Introducción: por qué los datos importan ahora más que nunca
El teatro siempre ha girado en torno a las personas. Gente en etapa, la gente detrás del escenario y la gente del público. Pero mientras artistas y gestores saben instintivamente que el público está en el centro de todo, la mayoría de los cines todavía tienen problemas con una pregunta básica: ¿Quiénes son exactamente nuestras audiencias y cómo podemos atraer a más personas?
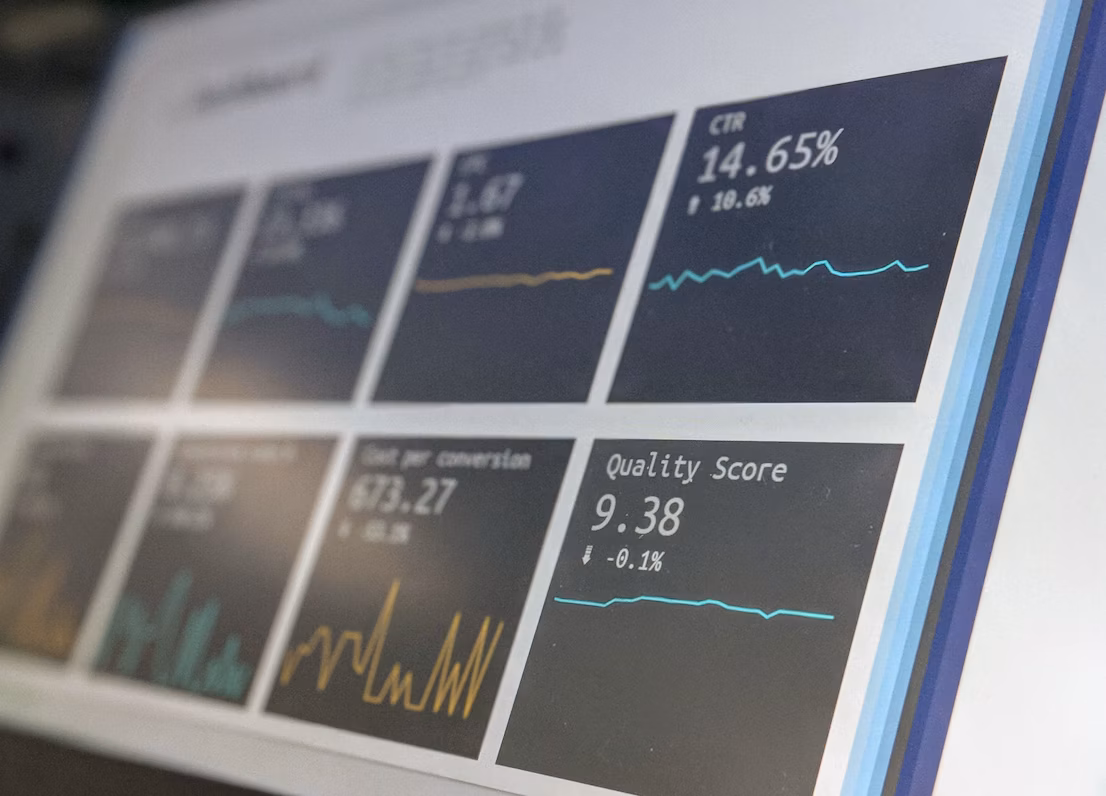
En una época en la que gigantes del streaming como Netflix o Spotify adaptan las recomendaciones a los gustos individuales, los cines no pueden darse el lujo de confiar únicamente en el instinto, la tradición o «lo que funcionó el año pasado». Para seguir siendo competitivos, necesitan usar una de las herramientas más poderosas disponibles: el análisis de datos.
Eso no significa convertir un teatro en una empresa de tecnología o enterrar al personal en hojas de cálculo. Significa usar la información que ya recopilas: venta de entradas, visitas al sitio web, participación por correo electrónico, registros de donantes: para comprender mejor a su público y tomar decisiones más inteligentes. Cuando se usan bien, los datos pueden ayudar a cubrir más vacantes, aumentar la lealtad e incluso hacer que la programación sea menos riesgosa.
Este artículo explica cómo el análisis de datos puede funcionar en teatros de todos los tamaños, desde compañías nacionales hasta pequeños locales comunitarios, y muestra cómo convertir números en casas llenas.
Qué significa realmente el «análisis de datos» para los cines
La frase «análisis de datos» puede sonar intimidante. Pero, en esencia, simplemente significa hacer preguntas y usar números para encontrar las respuestas.
En el caso de los cines, podría tener el siguiente aspecto:
- ¿Qué programas se venden mejor las noches de lunes a viernes que los fines de semana?
- ¿Con cuánto tiempo de antelación compran las entradas los diferentes públicos?
- ¿Qué correos electrónicos de marketing realmente impulsan las compras?
- ¿Qué porcentaje de visitantes primerizos regresan alguna vez?
Las respuestas ya están ocultas en su sistema de taquilla, sitio web y herramientas de marketing. El análisis de datos consiste en descubrir esos patrones y actuar en consecuencia.
Es importante destacar que no se trata de «macrodatos» o algoritmos complicados. No necesitas ser Google. Solo necesitas usar la información que tienes para comprenda mejor a su público.
Por qué la mayoría de los cines infrautilizan sus datos
La verdad es que la mayoría de los cines ya recopilan mucha más información de la que utilizan. Cada venta de entradas captura detalles sobre quién compró, cuándo y a qué precio. Cada boletín informativo por correo electrónico registra las aperturas y los clics. Cada visita al sitio web deja un rastro en Google Analytics.
Pero este es el problema común:
- Los datos se encuentran en diferentes sistemas que no se comunican entre sí.
- El personal no se siente seguro al interpretar los números.
- Las decisiones de programación y marketing se toman basándose en el «instinto» y no en la evidencia.
¿El resultado? Se pierden oportunidades. Por ejemplo, es posible que no se dé cuenta de que las familias tienden a comprar hasta tarde o de que los jóvenes profesionales tienen más probabilidades de asistir los jueves. Sin perspicacia, es posible que estés promocionando los programas equivocados para los grupos equivocados en el momento equivocado.
Primer paso: comience con preguntas claras
Antes de ahogarse en hojas de cálculo, el primer paso es saber lo que quieres aprender. De lo contrario, los datos se convierten en ruido.
Algunas preguntas importantes para empezar a hacer en los cines son las siguientes:
- ¿Cuáles son nuestras audiencias más leales y qué compran con más frecuencia?
- ¿Cuánto tiempo antes de una actuación la gente suele reservar? ¿Varía según el tipo de espectáculo?
- ¿Qué canales de marketing realmente venden entradas y cuáles solo generan «me gusta»?
- ¿Cuál es la tasa de asistencia repetida para quienes visitan por primera vez?
- ¿Hay puntos de precio específicos en los que las ventas disminuyen?
Hacer estas preguntas enmarca el análisis de una manera que se conecta directamente con su objetivo: llenar más puestos.
Segundo paso: obtenga las herramientas adecuadas
No necesita un presupuesto de Silicon Valley para utilizar la analítica de forma eficaz. Muchas herramientas son asequibles y algunas son gratuitas. Estas son algunas que vale la pena considerar:
- Sistemas de taquilla y CRM (Spektrix, Tessitura, AudienceView): ya recopilan abundantes datos de clientes y ofrecen paneles de informes.
- Google Analytics (GA4): Gratis, rastrea cómo las personas encuentran y usan tu sitio web.
- Plataformas de marketing por correo electrónico (Mailchimp, Campaign Monitor, Dotdigital): muestra las tasas de apertura y de clics, revelando qué es lo que impulsa la acción.
- Herramientas de encuesta (SurveyMonkey, Typeform): ayuda a captar los comentarios directos de la audiencia.
- Hojas de cálculo de Excel o Google: No las subestime: las tablas dinámicas simples pueden revelar grandes conocimientos.
Para los cines más pequeños, incluso empezar con una o dos de estas herramientas puede marcar una gran diferencia.
Paso tres: encuentra los patrones de audiencia
Una vez que comience a analizar los datos, los patrones emergerán rápidamente. Estos son algunos ejemplos que los cines suelen encontrar:
- Compra de ventanas: Las audiencias mayores pueden reservar con meses de antelación, mientras que las audiencias más jóvenes esperan hasta la semana del espectáculo.
- Preferencia de día de la semana: Algunos grupos prefieren las matinés de los sábados, otros por la noche a mitad de semana.
- Sensibilidad a los precios: Es posible que las familias respondan mejor a los paquetes con descuento, mientras que los fanáticos más dedicados estarán encantados de pagar tarifas superiores.
- Respuesta de marketing: El correo electrónico puede superar a las redes sociales en cuanto a conversiones, incluso si las redes sociales obtienen más «me gusta».
Cada una de estas ideas tiene aplicaciones prácticas. Si sabe que el público más joven reserva tarde, puede ahorrar gastos de marketing hasta que se acerque la fecha. Si sabes que las familias prefieren los paquetes, puedes diseñar promociones en consecuencia.
Paso cuatro: usar los datos para guiar la programación
Aquí es donde la analítica puede parecer verdaderamente transformadora. Las decisiones de programación suelen ser las más estresantes para los directivos, ya que equilibran la ambición artística con la presión de la taquilla.
Los datos pueden ayudar a reducir el riesgo. Por ejemplo:
- Si las entradas para los musicales se agotan constantemente, pero las nuevas obras tienen dificultades, puedes equilibrar la temporada con un presentador musical y nuevas obras al mismo tiempo.
- Si los espectáculos familiares atraen a muchos visitantes por primera vez, puedes ampliar esa oferta para crear audiencias a largo plazo.
- Si la asistencia repetida es baja, podrías considerar la posibilidad de introducir programas de fidelización u ofertas después del espectáculo.
El objetivo no es permitir que los datos sustituyan el juicio artístico — es para darte más confianza a la hora de tomar decisiones y detectar oportunidades que de otro modo te perderías.
Paso cinco: medir el impacto del marketing
Uno de los usos más poderosos de la analítica es ver qué es lo que realmente impulsa las ventas. Con demasiada frecuencia, las salas gastan en campañas brillantes sin saber si funcionan.
Al rastrear los enlaces y las conversiones, puedes ver:
- ¿El último anuncio de Instagram realmente vendió entradas o solo generó clics?
- ¿Qué líneas de asunto de los boletines informativos por correo electrónico generan más reservas?
- ¿Los anuncios de búsqueda de Google atraen a nuevas audiencias o solo a clientes habituales que de todos modos habrían acudido?
Esta información le permite dejar de desperdiciar dinero en «métricas de vanidad» y centrarse en lo que realmente llena los puestos.
Paso seis: segmenta tus audiencias
No todos los públicos son iguales. Los datos te permiten agruparlos en segmentos significativos:
- Fieles clientes habituales: Asiste de 3 a 4 conciertos al año.
- Casuales: Venga una o dos veces.
- Principiantes: Visitantes nuevos.
- Audiencias caducadas: Hace más de dos años que no asisto.
Cada grupo necesita mensajes diferentes. Los clientes habituales pueden apreciar el contenido entre bastidores. Es posible que los principiantes necesiten garantías sobre el estacionamiento, los precios o qué esperar. Las audiencias inactivas pueden responder a una campaña de «te echamos de menos» con una oferta especial.
La segmentación es donde la analítica se convierte en una verdadera estrategia. Impide que envíes el mismo mensaje genérico a todo el mundo y, en cambio, construye relaciones que parecen personales.
Paso siete: accesibilidad e inclusión a través de los datos
Los análisis también pueden resaltar quién falta. Si los datos de audiencia muestran una baja asistencia de ciertos grupos de edad, comunidades étnicas o hablantes no nativos, no se trata solo de una estadística, sino de un desafío.
Por ejemplo, subtitulación de datos puede revelar si audiencias multilingües son más atractivos cuando hay traducciones disponibles. El seguimiento de las actuaciones accesibles puede mostrar la demanda de los clientes sordos o con problemas de audición. Estas ideas no solo haz crecer tu audiencia pero también fortalece tu la marca del teatro como inclusiva y acogedora.
Paso ocho: conectar los datos a todo el recorrido del cliente
La analítica no debe limitarse a la venta de entradas. Todo el viaje es importante:
- ¿Cómo se enteró el público del programa?
- ¿Qué los convenció de comprar?
- ¿Cuál fue su experiencia esa noche?
- ¿Te devolvieron, donaron o recomendaron a otras personas?
Las encuestas, los seguimientos por correo electrónico y el seguimiento de CRM pueden unir todo esto. Cuanto más completa sea la imagen, mejores serán sus decisiones.
Ejemplo del mundo real: un teatro de tamaño mediano
Opte por un teatro regional con 500 asientos que tenga problemas con una baja asistencia a mitad de semana. Al analizar los datos de taquilla, descubrieron:
- El público mayor reservó con meses de anticipación las matinés.
- Jóvenes profesionales compraron entradas de última hora, a menudo los jueves.
- Sus campañas de correo electrónico vendían más entradas que los anuncios en las redes sociales.
Armados con esto, cambiaron de estrategia:
- Se agregaron promociones específicas los jueves por la noche para el público más joven.
- Gasto publicitario reequilibrado, dedicando más tiempo al correo electrónico y a las búsquedas.
- Se introdujo un descuento de «paquete de amigos» para fomentar las reservas de grupos.
Resultado: Su asistencia promedio a mitad de semana aumentó un 15% a lo largo de una temporada, no porque cambiaran de programación, sino porque actuaron en función de los datos.
Superar las objeciones comunes
Muchos profesionales del teatro dudan a la hora de sumergirse en los datos. Entre las preocupaciones frecuentes se incluyen las siguientes:
- «No tenemos tiempo». — Empieza con algo pequeño. Incluso 30 minutos revisando los patrones de ventas mensuales pueden arrojar información.
- »Somos artistas, no científicos de datos». — No necesitas estarlo. Las herramientas son fáciles de usar, y el objetivo es la acción práctica, no la investigación académica.
- «Nuestras audiencias son impredecibles». — Es cierto, pero las tendencias existen. Incluso las pequeñas ideas pueden guiar la toma de mejores decisiones.
La clave es pensar en la analítica no como una carga, sino como otra forma de entender a tu audiencia, al igual que los grupos focales, las conversaciones con la audiencia o las reseñas.
El futuro: análisis predictivo
Si bien muchos cines recién comienzan con datos descriptivos (lo que ocurrió), el futuro apunta hacia el análisis predictivo (lo que sucederá). Los grandes recintos están experimentando con herramientas que pronostican la asistencia en función de los precios, la época del año o el comportamiento anterior.
Esto no significa entregar el control a las máquinas, sino utilizar todas las herramientas posibles para reducir el riesgo y planificar de forma más inteligente. En un clima de financiación difícil, esa puede ser la diferencia entre la supervivencia y el declive.
Conclusión: combinar arte y evidencia
Al final del día, el teatro siempre girará en torno a la creatividad, el riesgo y la pasión. El análisis de datos no reemplaza eso. Lo que hace es arrojar luz sobre el lado del público, ayudando a las salas a equilibrar la ambición artística con la realidad financiera.
Los cines que utilizan bien los datos comprenderán mejor a sus audiencias, comercializarán de manera más eficiente y ocuparán más asientos. Los cines que lo ignoran corren el riesgo de ser izquierda atrasado en un mundo en el que todas las demás formas de entretenimiento, desde el streaming hasta los deportes, ya utilizan la analítica para llamar la atención.
El futuro no son los datos en lugar de instinto. Es instinto, respaldado por pruebas. Y esa es una combinación lo suficientemente fuerte como para mantener vivos los teatros, relevante y llena de gente.